
This article aims to further customize you existing Issue Tracker application described in "Create an Issue Tracker App with Supabase in 15 Minutes".
This article is part of a series. If you haven't read the first part, you can find it here.

Windmill has a community website called Windmill Hub where - among other Scripts and Flows - you can find the full version of this App.
Where we left off
In the previous article, we created a basic Issue Tracker application with Supabase. We uploaded a few issues, displayed them in a table and created scripts to add new ones and delete them. There is only one part missing of the CRUD functionality - updating the issues.
Updating issues
For now, we are going to enable users to update only the status and the
severity properties of an issue but feel free to customize it your needs.
Let's start with adding titles for the update form:
-
Insert a
Textcomponent. -
Enter
Update Issueas the input. -
Select
Subtitleas the style. -
Align it vertically on the bottom.
-
Insert below a second
Textcomponent. -
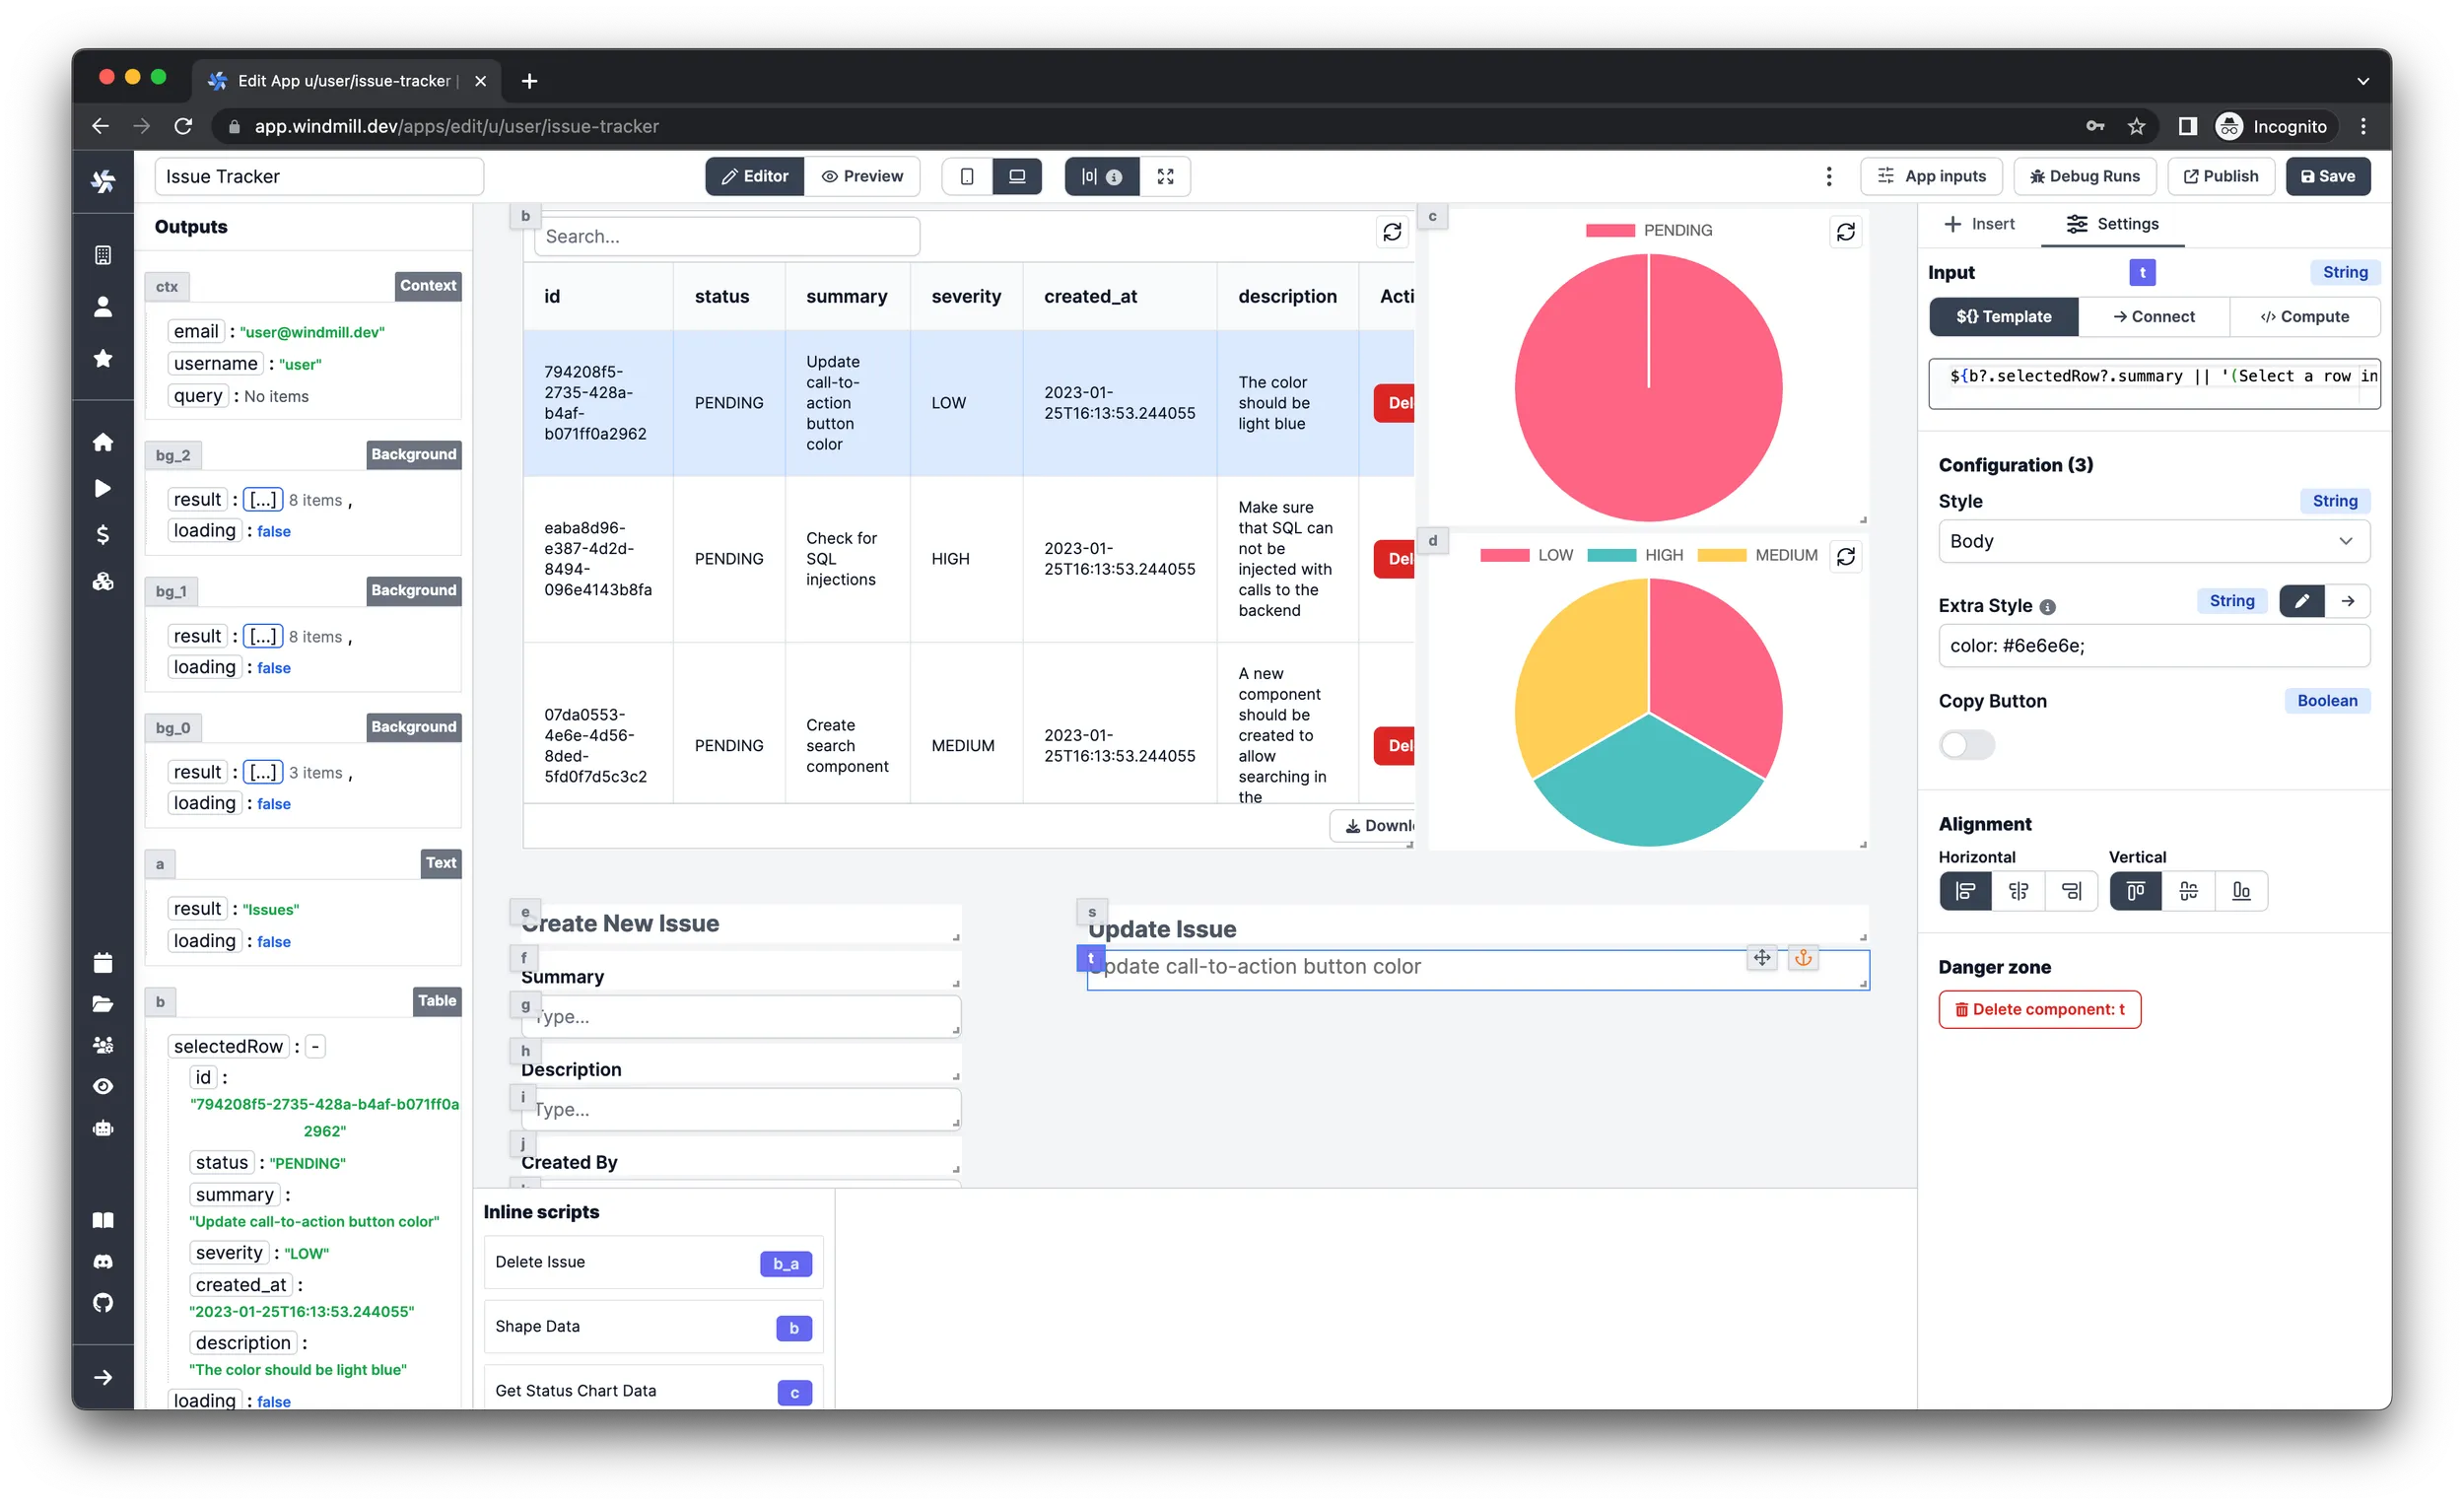
Enter
${b?.selectedRow?.summary || '(Select a row in the table)'}as the input.tipThe
bvariable is a reference to theTablecomponent. If you have a different ID for it, you need to change it accordingly. -
Enter
color: #6e6e6e;in the Extra Style argument.
Next, we need to add a Select component for the status property:
-
Insert a
Textcomponent. -
Enter
Statusas the input. -
Select
Labelas the style. -
Align it vertically on the bottom.
-
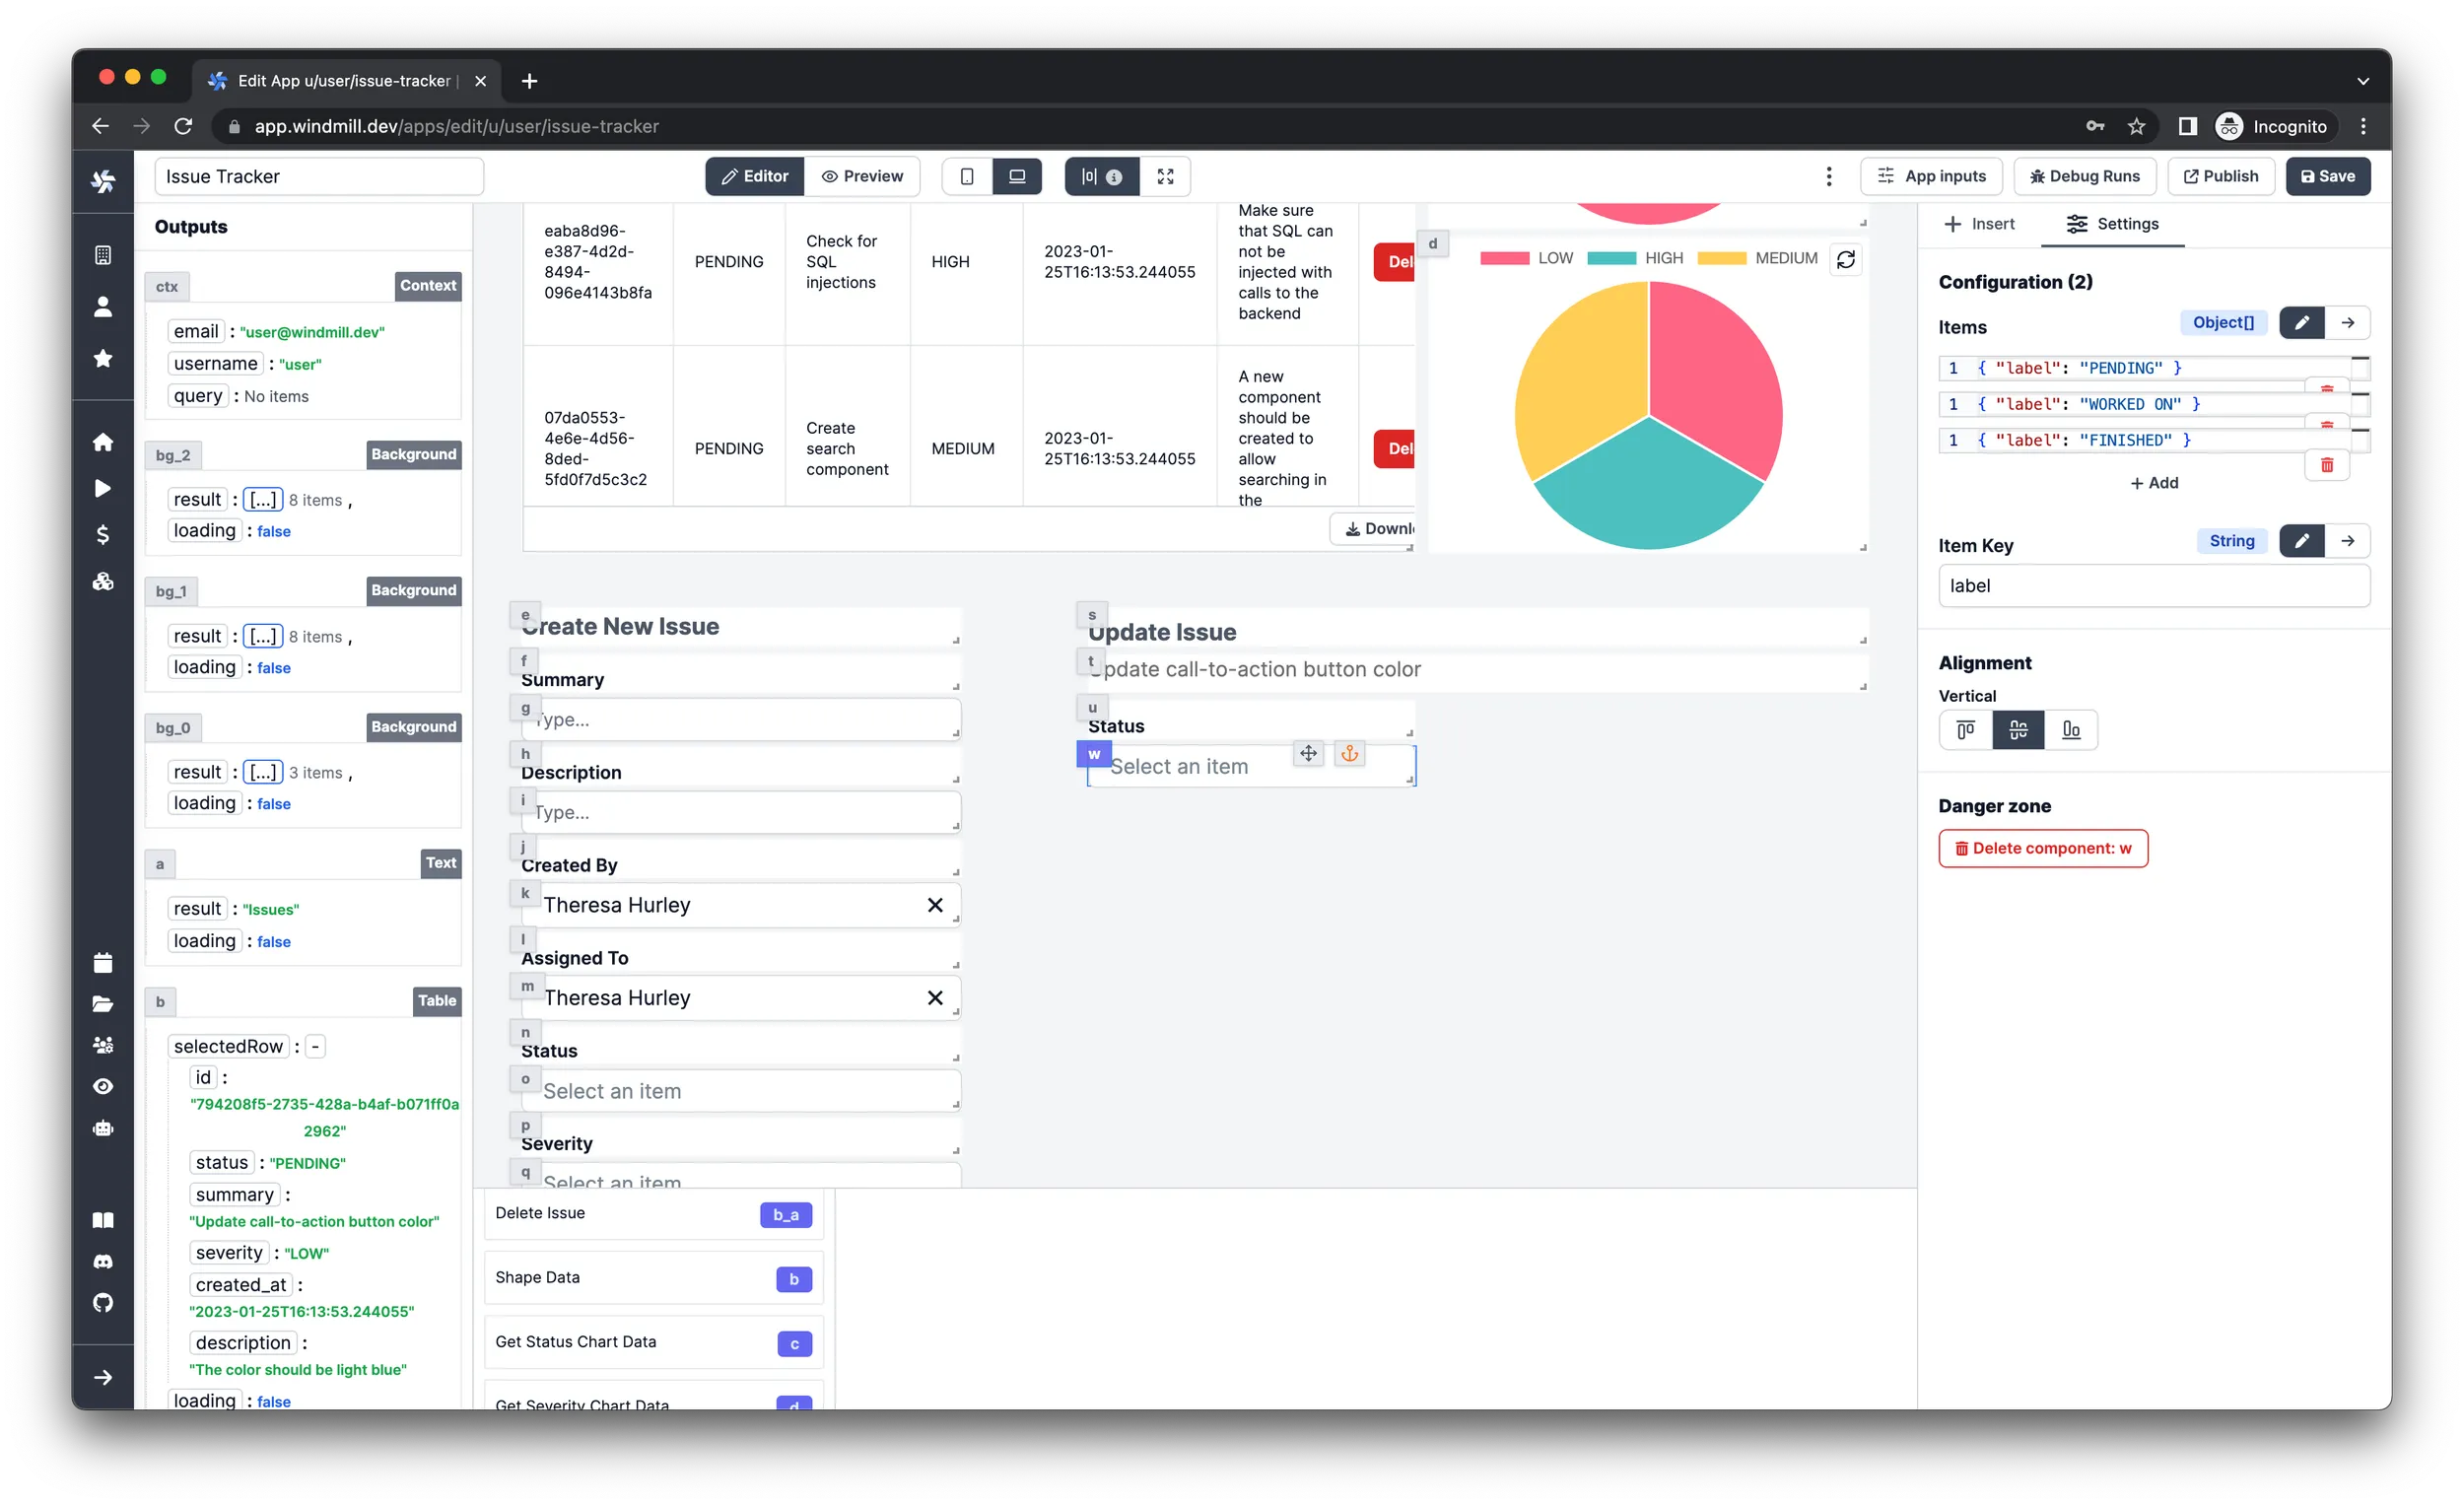
Insert below a
Selectcomponent. -
Enter these 3 items in the Configuration:
{ "label": "PENDING" }{ "label": "WORKED ON" }{ "label": "FINISHED" } -
Set the Item Key argument to
label.
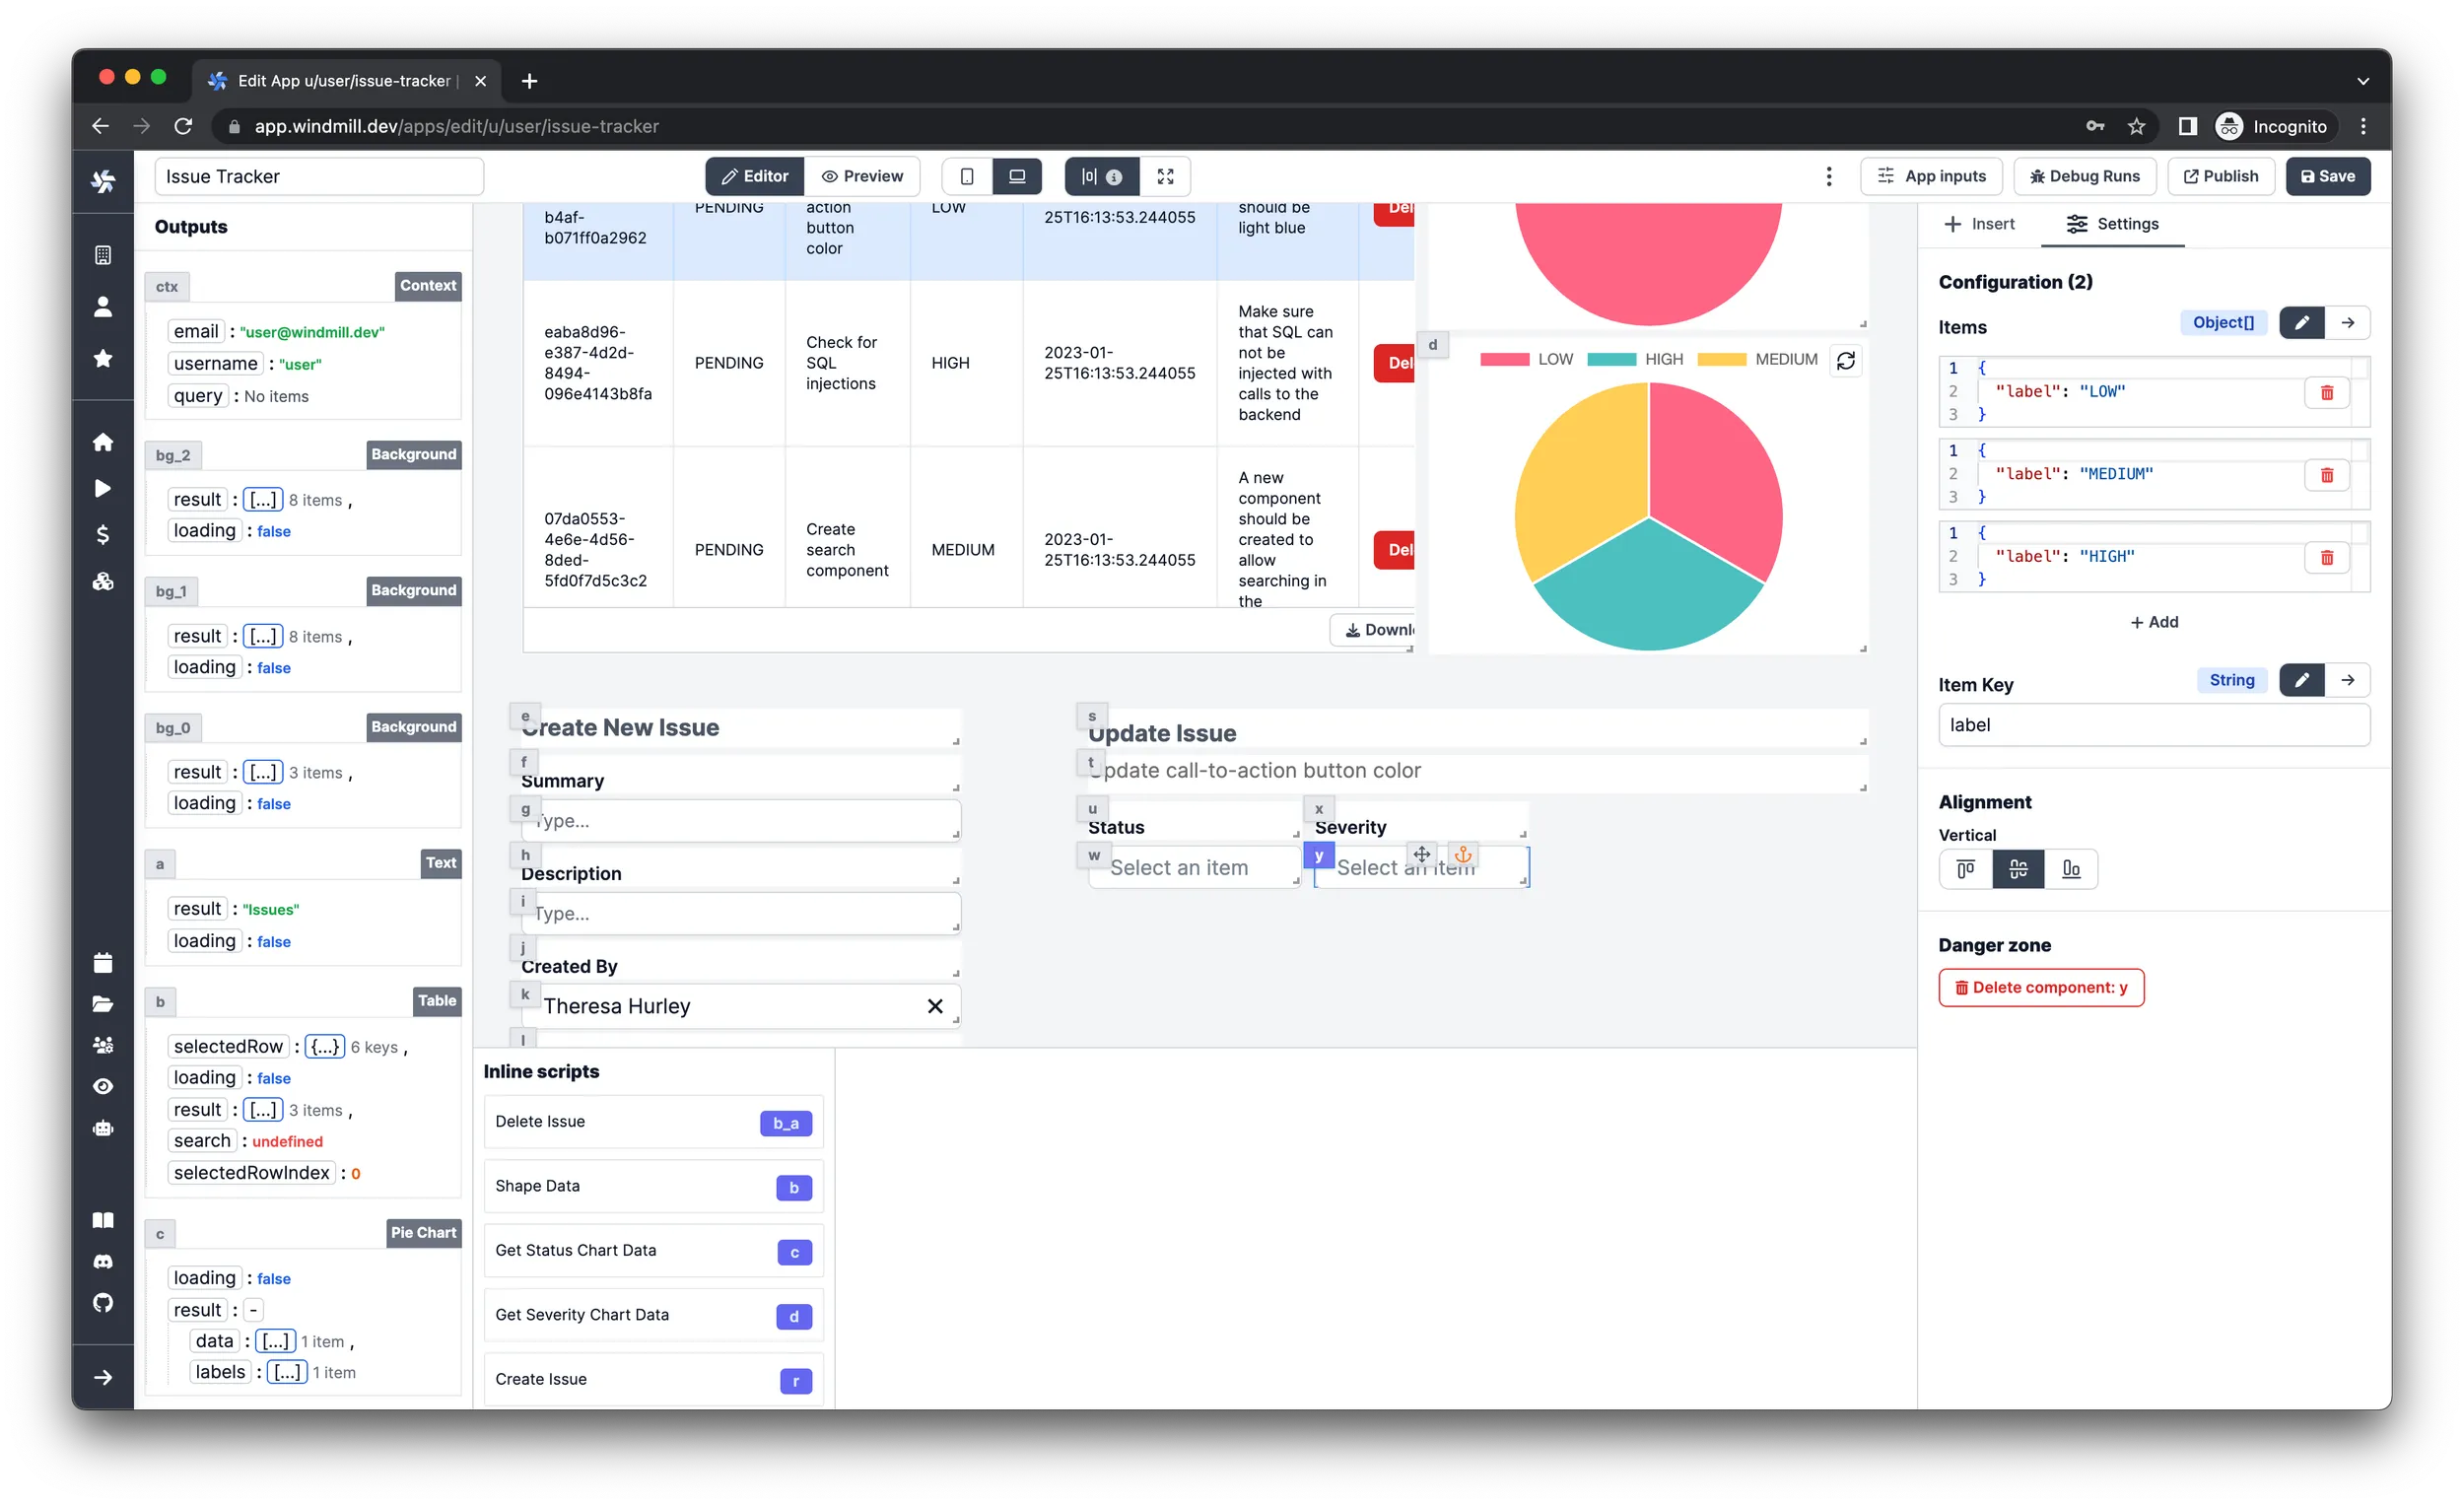
Repeat the previous steps for the severity property as well but with the
following items:
{ "label": "LOW" }
{ "label": "MEDIUM" }
{ "label": "HIGH" }
Finally, we need to add a Button component to submit the form:
-
Insert a
Buttoncomponent. -
Enter
Update Issueas the Label. -
Align it to the bottom-left corner.
-
Find the ID of the
Load Issuesbackground runnable and checkRecomputeon it in theRecompute otherssection. -
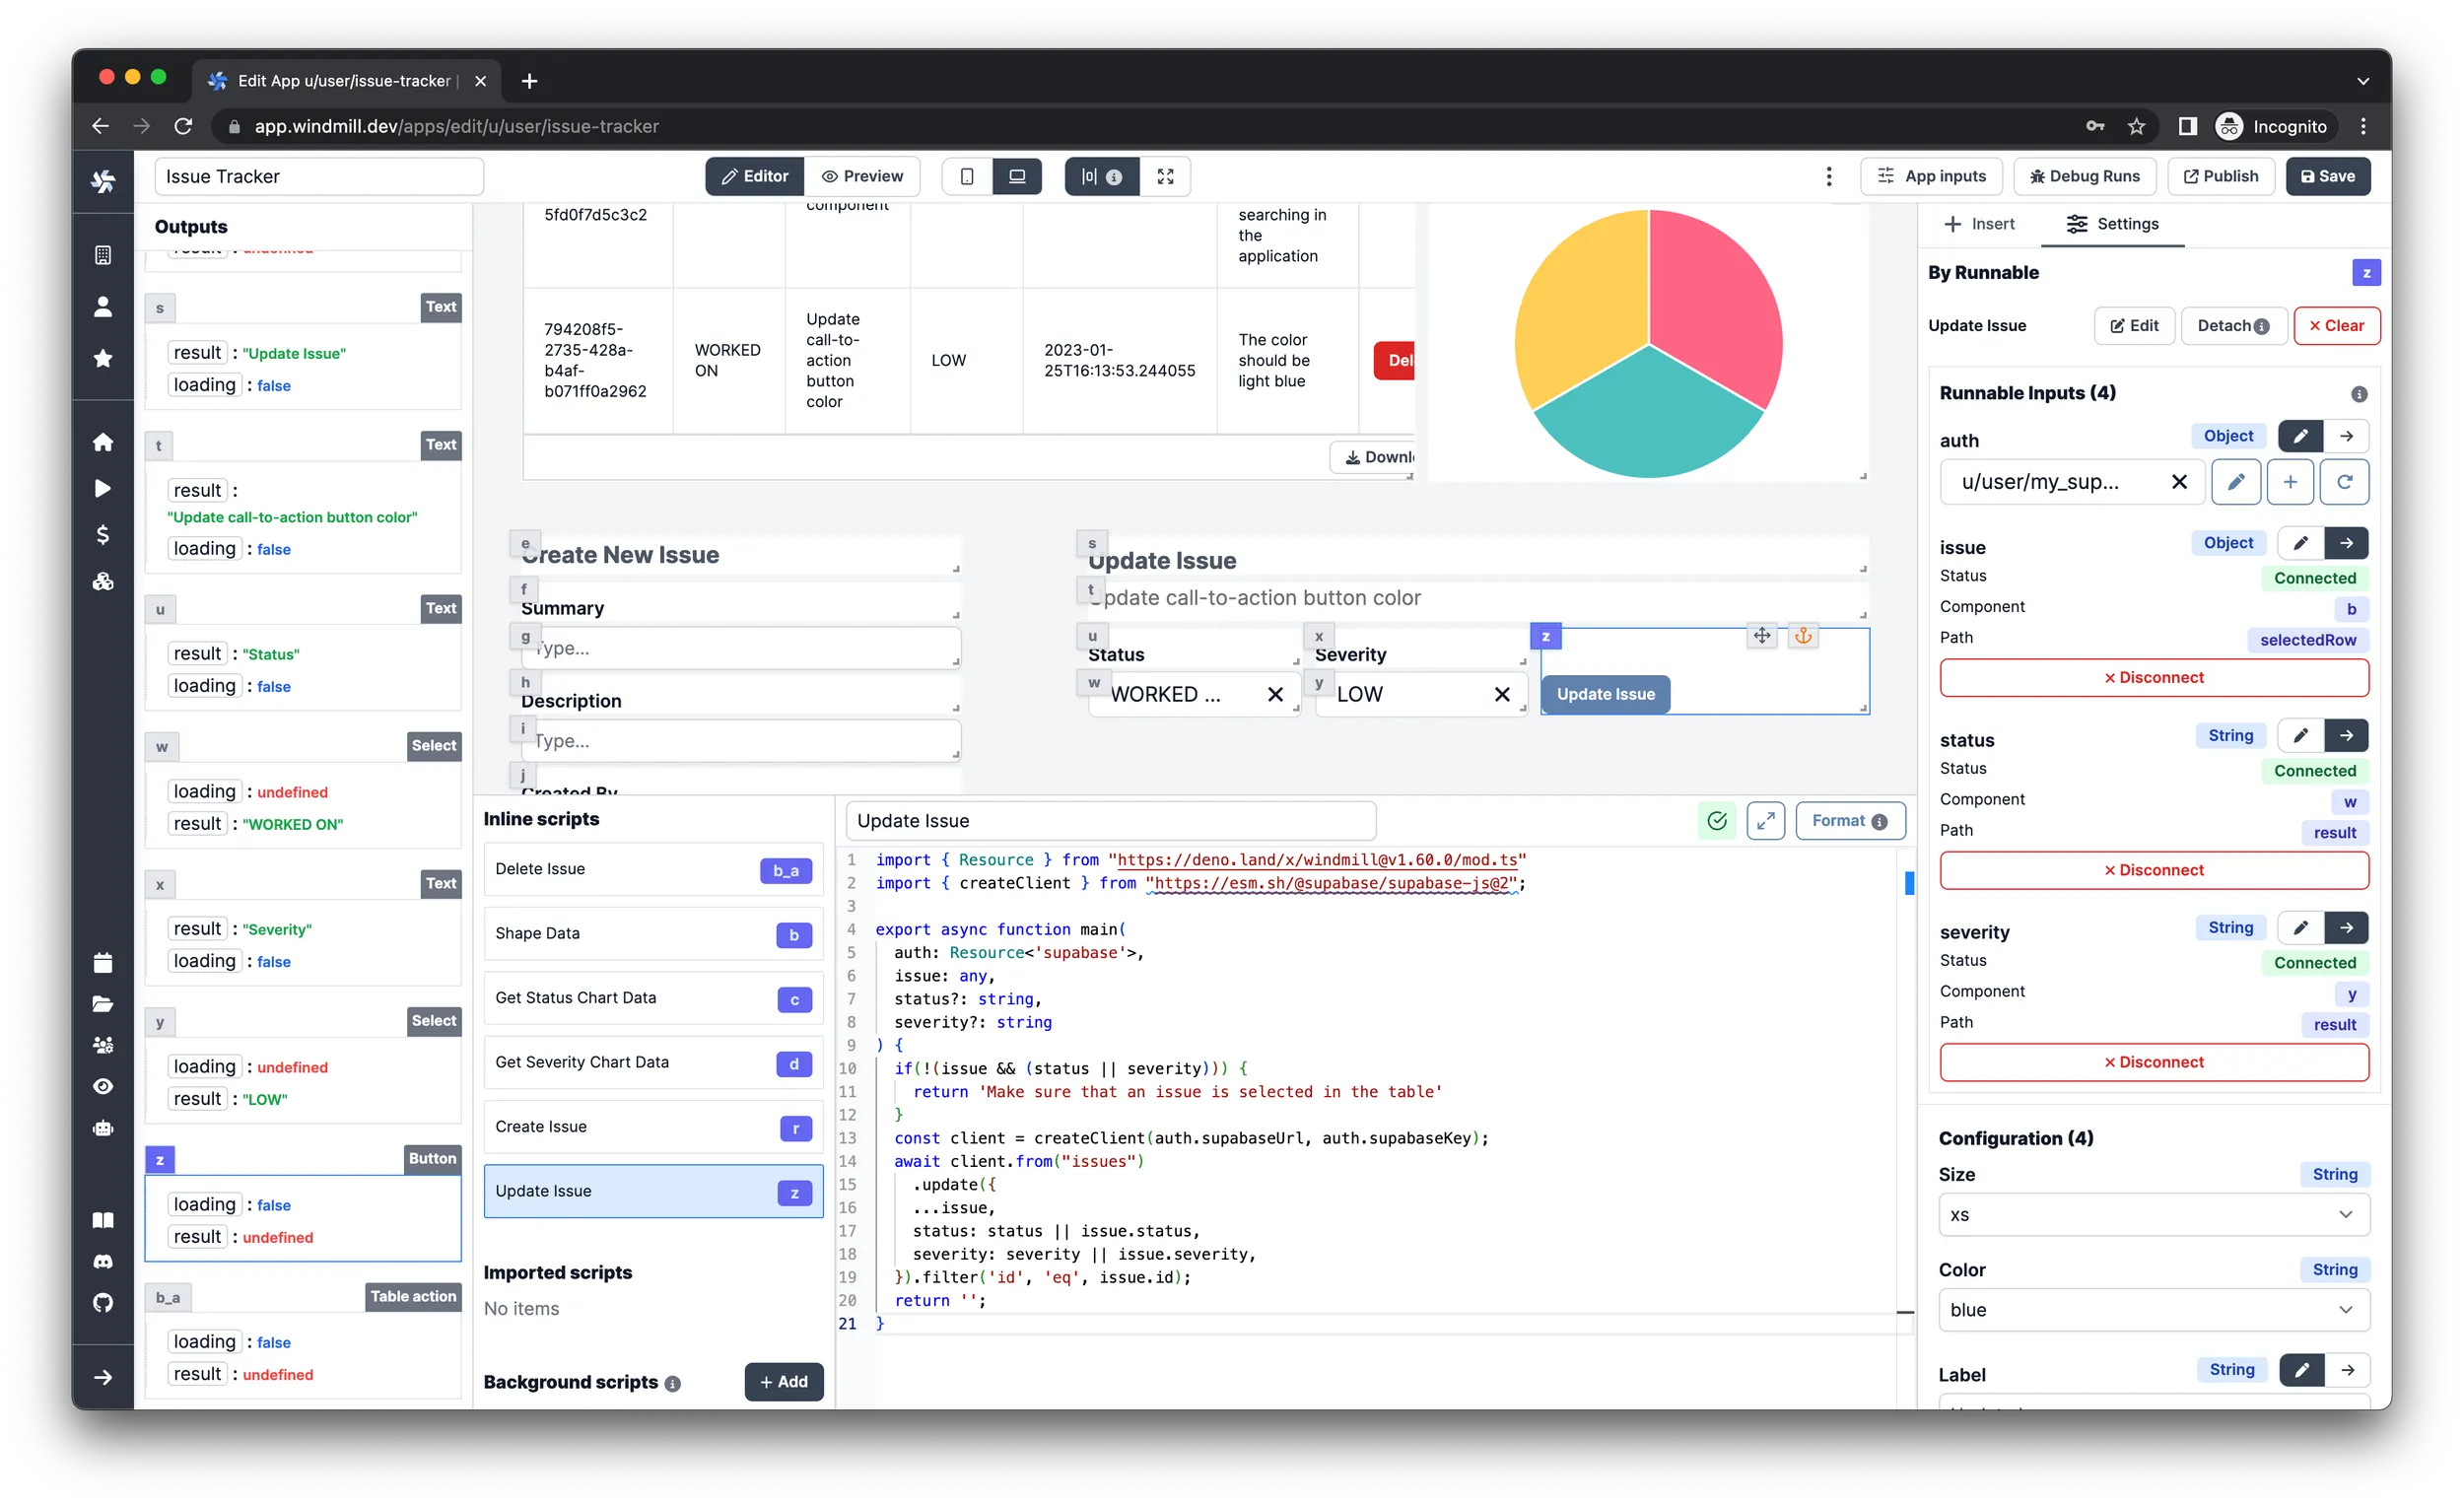
Click
Create an inline script, selectDenoas language, name itUpdate Issueand paste in the following code:import { createClient } from 'https://esm.sh/@supabase/supabase-js@2';
type Supabase = {
url: string;
key: string;
};
export async function main(auth: Supabase, issue: any, status?: string, severity?: string) {
if (!(issue && (status || severity))) {
return 'Make sure that an issue is selected in the table';
}
const client = createClient(auth.url, auth.key);
await client
.from('issues')
.update({
...issue,
status: status || issue.status,
severity: severity || issue.severity
})
.filter('id', 'eq', issue.id);
return '';
} -
Select your Supabase resource for the
authargument of the script in theSettingspane on the right. -
Select the
selectedRowproperty of theTablecomponent for theissueargument. -
Select the
resultproperty of the correspondingSelectcomponent for thestatusandseverityargument.
More charts
Now that we have a fully functional issue tracker, let's add one more chart,
namely a line chart to display the number of issues in the past days. Let's
start with adding a Number input to control how many days we want to display:
- Insert a
Numbercomponent. - Enter
Daysas the Placeholder. - Enter
30as the Default Value.
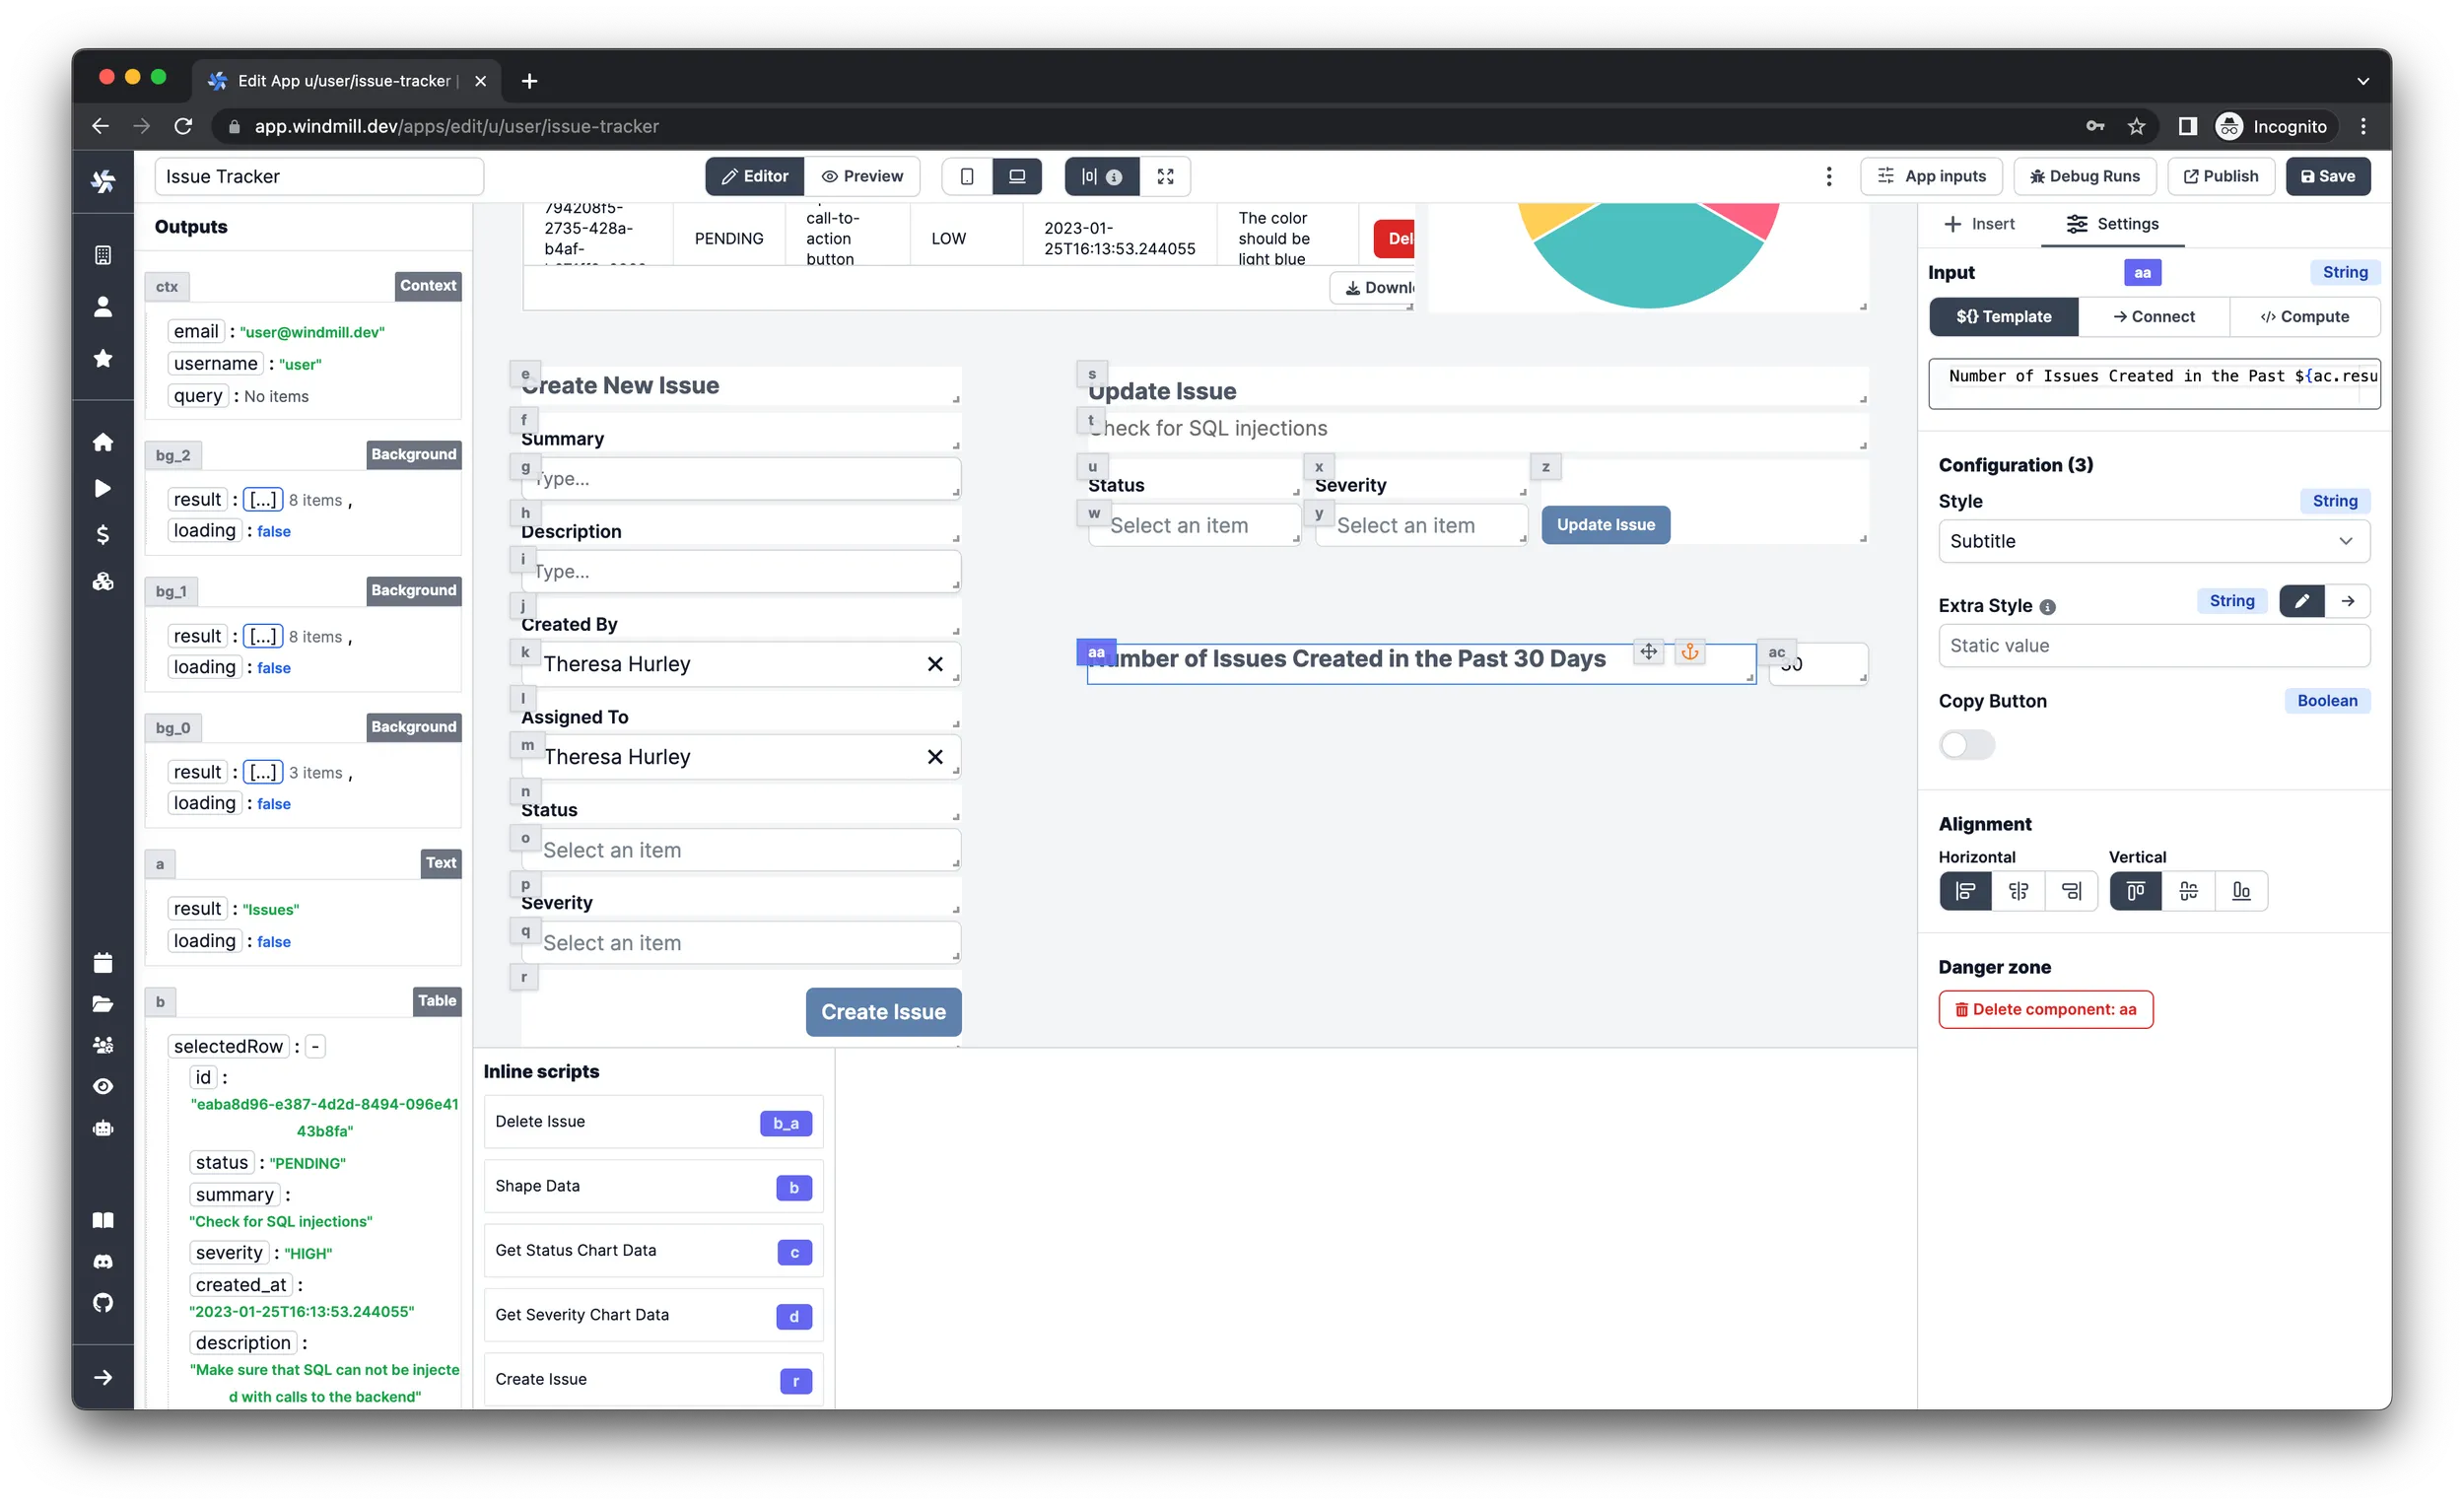
Next, create a title for the chart and use the value of the recently added number input:
-
Insert a
Textcomponent. -
Enter
Number of Issues Created in the Past ${ac.result || 30} Daysas the input.tipThe
acvariable is a reference to the previously addedNumbercomponent. If you have a different ID for it, you need to change it accordingly. -
Select
Subtitleas the style. -
Align it vertically on the bottom.
Lastly, add the actual chart component to display the data:
-
Insert a
Bar/Line Chartcomponent. -
Toggle the Line attribute.
-
Click
Create an inline script, selectDenoas language, name itLast Issues Chart Dataand paste in the following code:export async function main(issues: { created_at: string }[], days: number = 30) {
if (!issues?.length) {
return { data: [], labels: [] };
}
const dates = [...Array(days)]
.map((_, i) => {
const d = new Date();
d.setDate(d.getDate() - i);
return d.toISOString().split('T')[0];
})
.reverse();
const issueNumbers = dates.map((date) => {
return issues.filter(({ created_at }) => created_at.startsWith(date)).length;
});
return {
data: issueNumbers,
labels: dates
};
} -
Select the
resultproperty of theLoad Issuesbackground runnable for theissuesargument. -
Select the
resultproperty of the recently createdNumbercomponent for thedaysargument.
Responsive layout
Before finishing our app, the final step is to make the layout responsive. The
component layout can be configured in 2 views: desktop and mobile, which can
be toggled in the header row, next to the Editor-Preview mode switch. The
desktop view is used by default and is shown when the window width is greater
than 690px and the mobile view is shown when the width is less than or equal
to 690px. The views are saved separately, so moving the components around in one
of them will not affect the other. Let's switch to the mobile view and place
the components to resemble the following layout.
![]()
You can self-host Windmill using a
docker compose up, or go with the cloud app.